
10 network monitoring tools for mid-market teams in 2026
Jun 24, 2025
Network monitoring tools tell you a link is saturated at 2 a.m. Far fewer tell you who logged into the firewall and changed the rule that caused it. This list covers ten tools: nine that monitor performance, availability, and infrastructure health, and one that audits configuration changes and logons with the account behind each. Most mid-market teams need both jobs covered before an incident asks the second question.
Firewalls, VPN gateways, and other edge devices sit between the internet and everything else. In the Verizon 2026 Data Breach Investigations Report, victims of ransomware attacks on organizations with fewer than 1,000 employees had unpatched edge-device vulnerabilities in 29% of cases and compromised credentials in 38%.
Once a device like that is compromised, the questions are about change and access, not bandwidth
Most network monitoring tools answer the performance question well. They poll devices, chart interface utilization, and alert when something stops responding. Far fewer record the configuration changes, failed logins, and firmware updates that explain why the environment looks different this morning than it did last night.
The ten tools below fall into two groups. Nine monitor performance, availability, and infrastructure health, and one audits who changed a device and what the change was.
What is a network monitoring tool?
A network monitoring tool is software that continuously observes network devices and traffic, collects performance and availability data, and alerts administrators when conditions cross defined thresholds.
It typically polls routers, switches, firewalls, servers, and endpoints over standard protocols, then presents the results as dashboards, reports, and alerts.
The category splits along a line worth naming early. Performance monitoring answers whether the network is working, covering device reachability, link saturation, and rising latency.
Security and configuration monitoring answers who changed it, what the value was before, and whether that change was authorized. Most products lean heavily toward the first. Incident response and audit work depend on the second.
Network monitoring tools at a glance
The table below maps each tool to its primary job, deployment, free-tier availability beyond a trial, and the environment it suits best.
Tool | Primary job | Deployment | Free tier | Best for |
|---|---|---|---|---|
|
Netwrix Auditor for Network Devices |
Configuration change and login auditing |
On-premises |
Trial |
Teams needing audit evidence for network devices |
|
SolarWinds Network Performance Monitor |
Performance and fault monitoring |
On-premises |
Trial |
Large routed environments with deep SNMP needs |
|
Paessler PRTG Network Monitor |
All-in-one sensor-based monitoring |
On-premises |
Yes, limited sensors |
Mixed environments wanting one tool |
|
ManageEngine OpManager |
Performance and fault monitoring |
On-premises |
Trial only |
Budget-conscious teams monitoring by device count |
|
Zabbix |
Open-source infrastructure monitoring |
Self-hosted |
Yes, fully open source |
Teams with engineering time to invest |
|
Nagios XI |
Infrastructure monitoring with plugins |
Self-hosted |
Nagios Core is free |
Environments already running Nagios Core |
|
Datadog Network Performance Monitoring |
Cloud and hybrid flow monitoring |
SaaS |
Trial |
Cloud-native and containerized workloads |
|
Auvik Network Management |
Automated mapping and configuration backup |
SaaS |
Trial |
Lean teams and managed service providers |
|
LM Envision by LogicMonitor |
Agentless hybrid observability |
SaaS |
Trial |
Hybrid estates wanting minimal maintenance |
|
Progress WhatsUp Gold |
Performance and availability monitoring |
On-premises |
Free tools available |
Windows-centric mid-market networks |
Types of network monitoring tools
Tools in this space collect data in fundamentally different ways, and the collection method determines what questions the tool can answer. Most teams end up running two or three categories together.
SNMP-based monitoring
Simple Network Management Protocol (SNMP) polling underpins traditional network monitoring. The tool queries devices at intervals for counters such as interface throughput, error rates, CPU, and memory, then charts and alerts on the results. Nearly every router, switch, and firewall supports it, which makes SNMP the broadest-coverage option available.
Its limitation is that polling shows state, not events. A device polled every five minutes can absorb a configuration change, a reboot, and a rollback between samples with nothing recorded but a small gap in the graph.
Flow-based monitoring
Flow monitoring uses NetFlow, sFlow, or Internet Protocol Flow Information Export (IPFIX) to collect metadata about conversations crossing the network, including source, destination, port, protocol, and volume. This answers questions SNMP can't, such as which host consumed the bandwidth and which application drove the spike.
Flow data describes traffic without capturing content, which keeps storage manageable. It won't tell you what was inside the session.
Packet capture and deep packet inspection
Packet capture records the traffic itself, and deep packet inspection (DPI) parses it to identify applications and payload characteristics. Security products also use DPI to detect malicious traffic by correlating packets into attacks. This is the highest-fidelity option and the most expensive in storage and processing, so teams typically deploy it at chokepoints rather than everywhere. The tools below don't center on DPI-based threat detection, which belongs to intrusion detection and network detection and response products.
Synthetic and active monitoring
Synthetic monitoring generates test traffic on a schedule, measuring reachability, latency and response time along specific paths. It surfaces problems before users report them and validates performance across links you don't own, including internet and provider paths.
Agent-based infrastructure monitoring
Agents installed on servers and endpoints report metrics the network itself can't see, including process-level resource use and application health. Modern observability platforms lead with this model and treat network telemetry as one input among several.
Configuration and log change auditing
This category monitors devices, not traffic. It records configuration changes with before-and-after values, successful and failed administrative logins, and firmware updates, then attributes each to a specific user account.
It matters because the other five categories largely miss it. A performance tool notices that a firewall started dropping traffic differently. Only change auditing shows that an administrator modified an access rule at 02:14 and what the rule said beforehand.
When an auditor asks who changed a device, or an investigation needs to establish whether an intrusion involved legitimate credentials, this is the only category that answers.
Netwrix approaches network monitoring from here, which is why the two capabilities usually sit side by side rather than competing. Native network device auditing rarely covers the gap on its own.
What to look for in network monitoring tools
Six criteria separate tools that survive a proof of concept from tools that look good in a demo.
- Protocol and device coverage: Confirm support for the specific hardware in your environment, not just the vendor names. Cisco IOS, Cisco ASA, Fortinet FortiGate, Palo Alto, SonicWall, Juniper and Cisco Meraki each expose data differently, and coverage of one model rarely means coverage of the whole line. Different types of network devices expose entirely different counters, which is why a shortlist built on vendor logos tends to fall apart during testing.
- Licensing model: This is where budgets break. Vendors charge per device, per sensor, per interface, per host, or by log volume, and the same network can cost wildly different amounts depending on which. Sensor-based pricing punishes environments with many monitored elements per device, and log-volume pricing punishes chatty firewalls.
- Alert tuning: A tool that alerts on everything trains the team to ignore it. Look at how thresholds are set, whether alerts can depend on parent-child device relationships, and whether maintenance windows automatically suppress noise.
- Retention and evidence quality: Performance data is usually rolled up and averaged over time, which is fine for capacity planning and useless for an investigation six months later. If the data needs to serve an audit, confirm what's retained at full fidelity and for how long. Audit log management practices apply here as much as they do to servers, and event log monitoring covers the same ground for the systems behind them.
- Change attribution: Ask whether the tool records who made a change, not only that something changed. Many performance products detect configuration drift and report the delta without a username attached, which stops an investigation at exactly the wrong moment.
- Integration with security workflows: Network telemetry gains value when it reaches the tools running the response. Check native support for your SIEM, since SIEM and firewall integration decides whether device events arrive parsed and searchable, or as raw syslog text nobody queries.
Netwrix Auditor for Network Devices records configuration changes, logon attempts and firmware updates across routers, switches and firewalls with the account behind each one. Start a free trial.
Network monitoring tools for mid-market teams
Each entry below covers what the tool does, where it's strong, where it falls short, and the environment it fits.
1. Netwrix Auditor for Network Devices
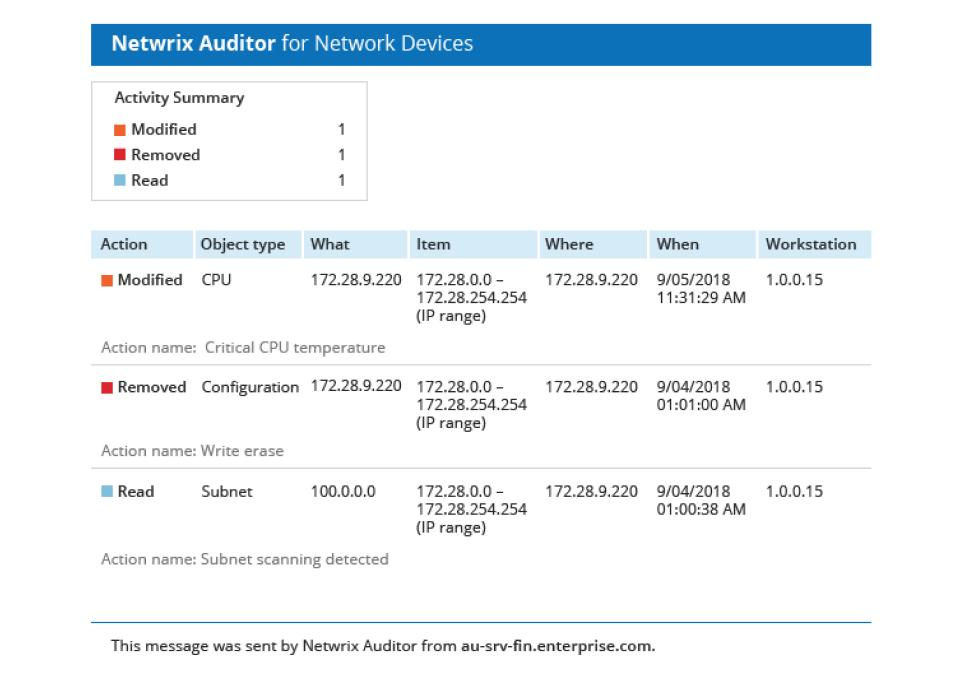
Netwrix Auditor for Network Devices audits configuration changes, logon activity and security-relevant events on routers, switches, firewalls and VPN appliances. It answers who logged in, what configuration changed and whether the device is operating within approved parameters, rather than whether it's up or down.
What stands out:
- Configuration change auditing with attribution: Records configuration changes, who made them and when, using native logs and syslog. Supported platforms include Cisco ASA and IOS, Cisco Firepower Threat Defense (FTD), Fortinet FortiGate, Palo Alto, SonicWall, Juniper, Cisco Meraki, HPE Aruba and Pulse Connect Secure.
- VPN and direct logon monitoring: Captures logon attempts and administrative activity on network devices. For Pulse Connect Secure, audited events include login and logout, VPN tunneling, administrator logins and administrator changes.
- Scanning visibility and hardware malfunction alerting: Surfaces port scanning activity, power supply failures and critical CPU temperature events, combining behavioral visibility with hardware health before either escalates.
- Pre-built compliance reports: Ships reports grouped by PCI DSS, HIPAA, SOX and GDPR, with documented coverage extending to NIST SP 800-53 and ISO/IEC 27001, so device evidence arrives in the structure auditors expect.
- Predictable licensing: Charges by Active Directory user rather than by log source or device count, which keeps costs stable as the number of monitored devices grows.
What to consider:
- Covers log and configuration auditing rather than SNMP performance monitoring, so pair it with a dedicated performance tool for bandwidth and availability.
- Coverage is vendor-specific. Verify the supported platform and version list against your own network stack before deployment.
- Deployment is on-premises, which suits regulated and hybrid environments and rules it out for teams committed to fully cloud-hosted tooling.
Best for: Security and compliance teams in mid-market organizations that need audit-ready evidence of network device logon activity and configuration changes for PCI DSS, HIPAA, SOX, or GDPR programs.
Christchurch Airport, New Zealand's second-busiest airport, closed that gap, gaining a detailed audit trail across routers, firewalls and switches for PCI DSS while saving roughly five hours a week previously spent auditing by hand.
2. SolarWinds Network Performance Monitor
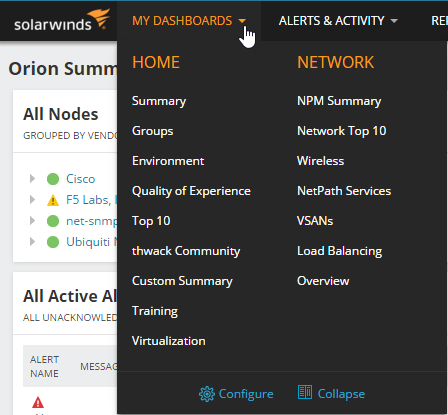
SolarWinds Network Performance Monitor (NPM) is a long-established platform for fault, availability and performance monitoring across routed and switched environments, built on SNMP polling with topology mapping and path analysis.
source: documentation.solarwinds.com
What stands out:
- NetPath hop-by-hop analysis traces performance across networks you don't control, including internet and provider paths.
- Deep multi-vendor device support with a large library of templates covering hardware most tools miss.
- Mature alerting with dependency awareness, so an upstream failure doesn't generate alerts for every device behind it.
What to consider:
- The full Orion platform is heavy to deploy and maintain, and it typically needs a dedicated owner.
- Licensing scales by monitored elements and rises quickly in large environments.
- Capability arrives through separate modules, so the entitlement conversation gets complicated.
Best for: Large routed environments with the staff to run a full-featured on-premises platform.
3. Paessler PRTG Network Monitor
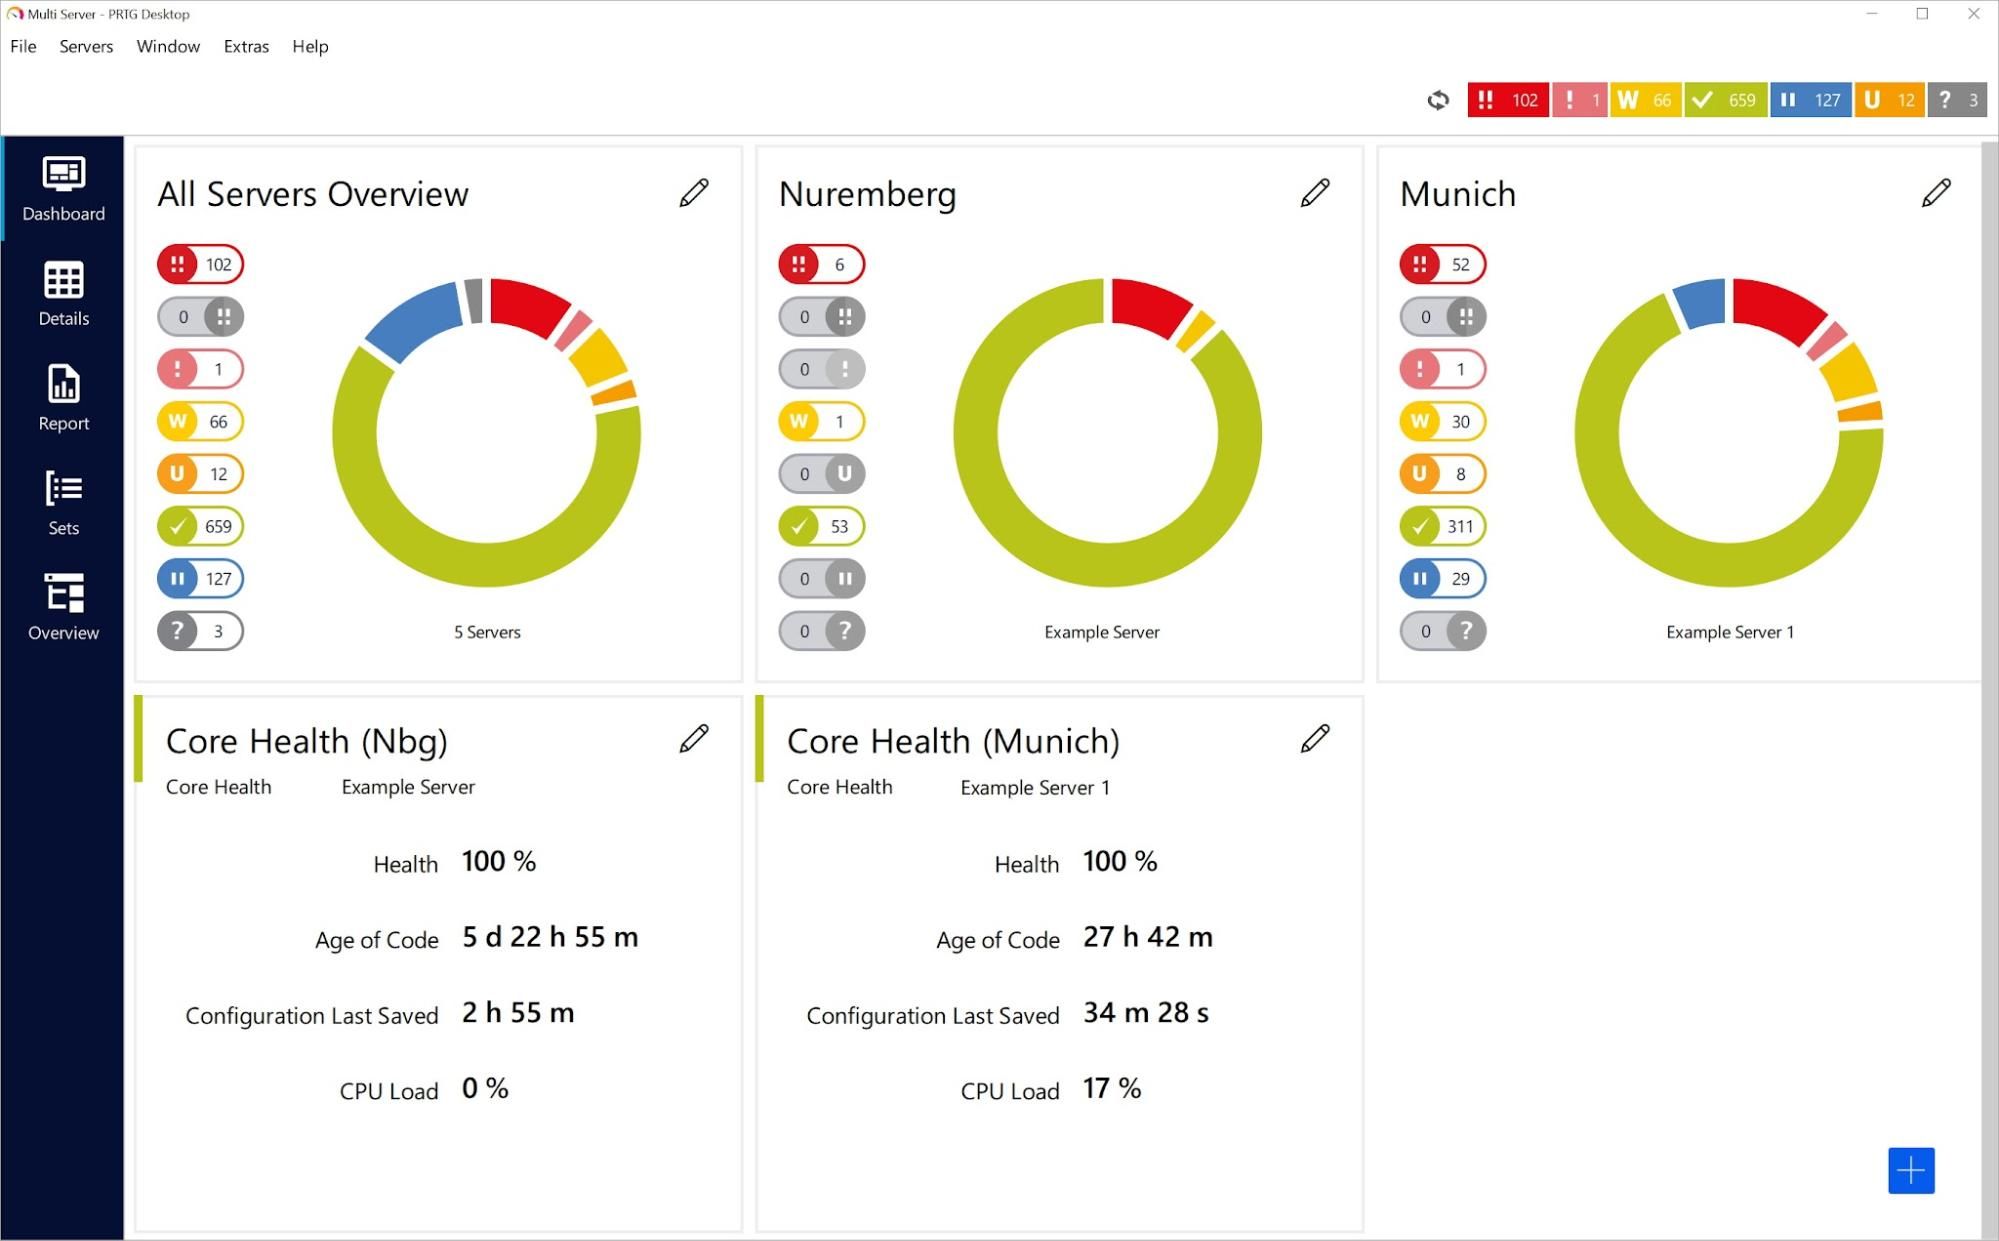
PRTG monitors networks through configurable sensors, each tracking one metric on one device. Coverage spans SNMP, flow protocols, packet sniffing, Windows Management Instrumentation and HTTP checks in a single product.
source: paessler.com
What stands out:
- One product covers several monitoring categories, which suits teams that prefer not to stitch tools together.
- Auto-discovery quickly builds an initial device inventory, shortening setup.
- A permanently free tier exists below a sensor threshold, so small environments can run it indefinitely.
What to consider:
- Model sensor-based licensing carefully. A single switch can consume dozens of sensors, and costs climb faster than device counts suggest.
- Security and change auditing depth is limited compared with dedicated tooling.
- The interface carries a lot of history and takes time to navigate comfortably.
Best for: Small and mid-sized mixed environments wanting broad coverage from a single tool.
4. ManageEngine OpManager
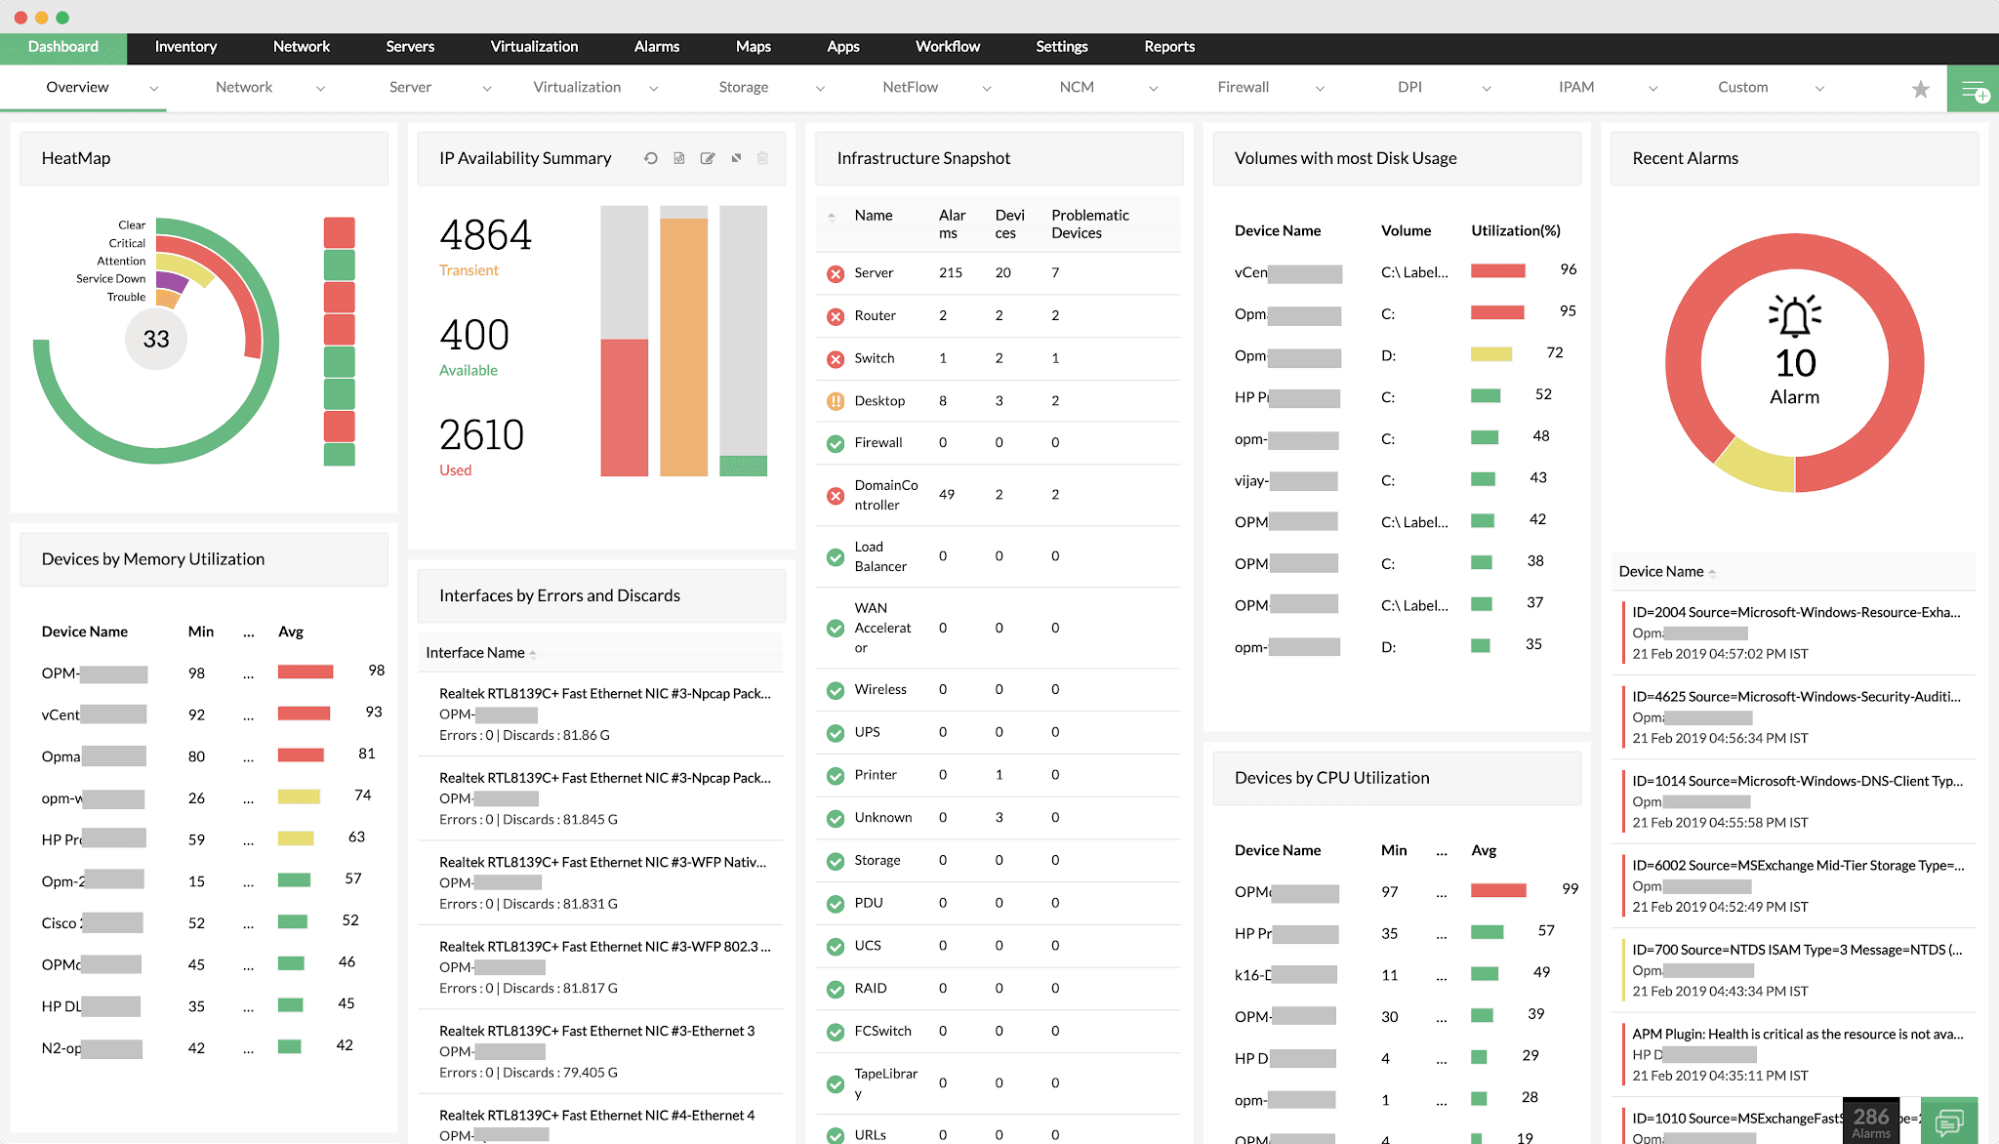
ManageEngine OpManager provides performance and fault monitoring for networks, servers and virtual infrastructure, with device-based licensing and a large template library.
source: manageengine.com
What stands out:
- Transparent device-based pricing, starting at $245 for 25 devices on the Standard edition and $345 for 25 devices on Professional, with Enterprise at $4,595 for 250 devices.
- Strong virtualization coverage across VMware, Hyper-V and Nutanix alongside network devices.
- Workflow automation can execute corrective actions when defined conditions trigger.
What to consider:
- No permanently free edition. Evaluation runs on a 30-day trial.
- Full capability requires add-ons such as NetFlow Analyzer and Network Configuration Manager, so the quoted device price rarely reflects the final cost.
- Change auditing across the wider Microsoft estate uses log-source licensing, a different cost model from Active Directory user-based pricing.
Best for: Budget-conscious teams monitoring a countable number of devices.
5. Zabbix
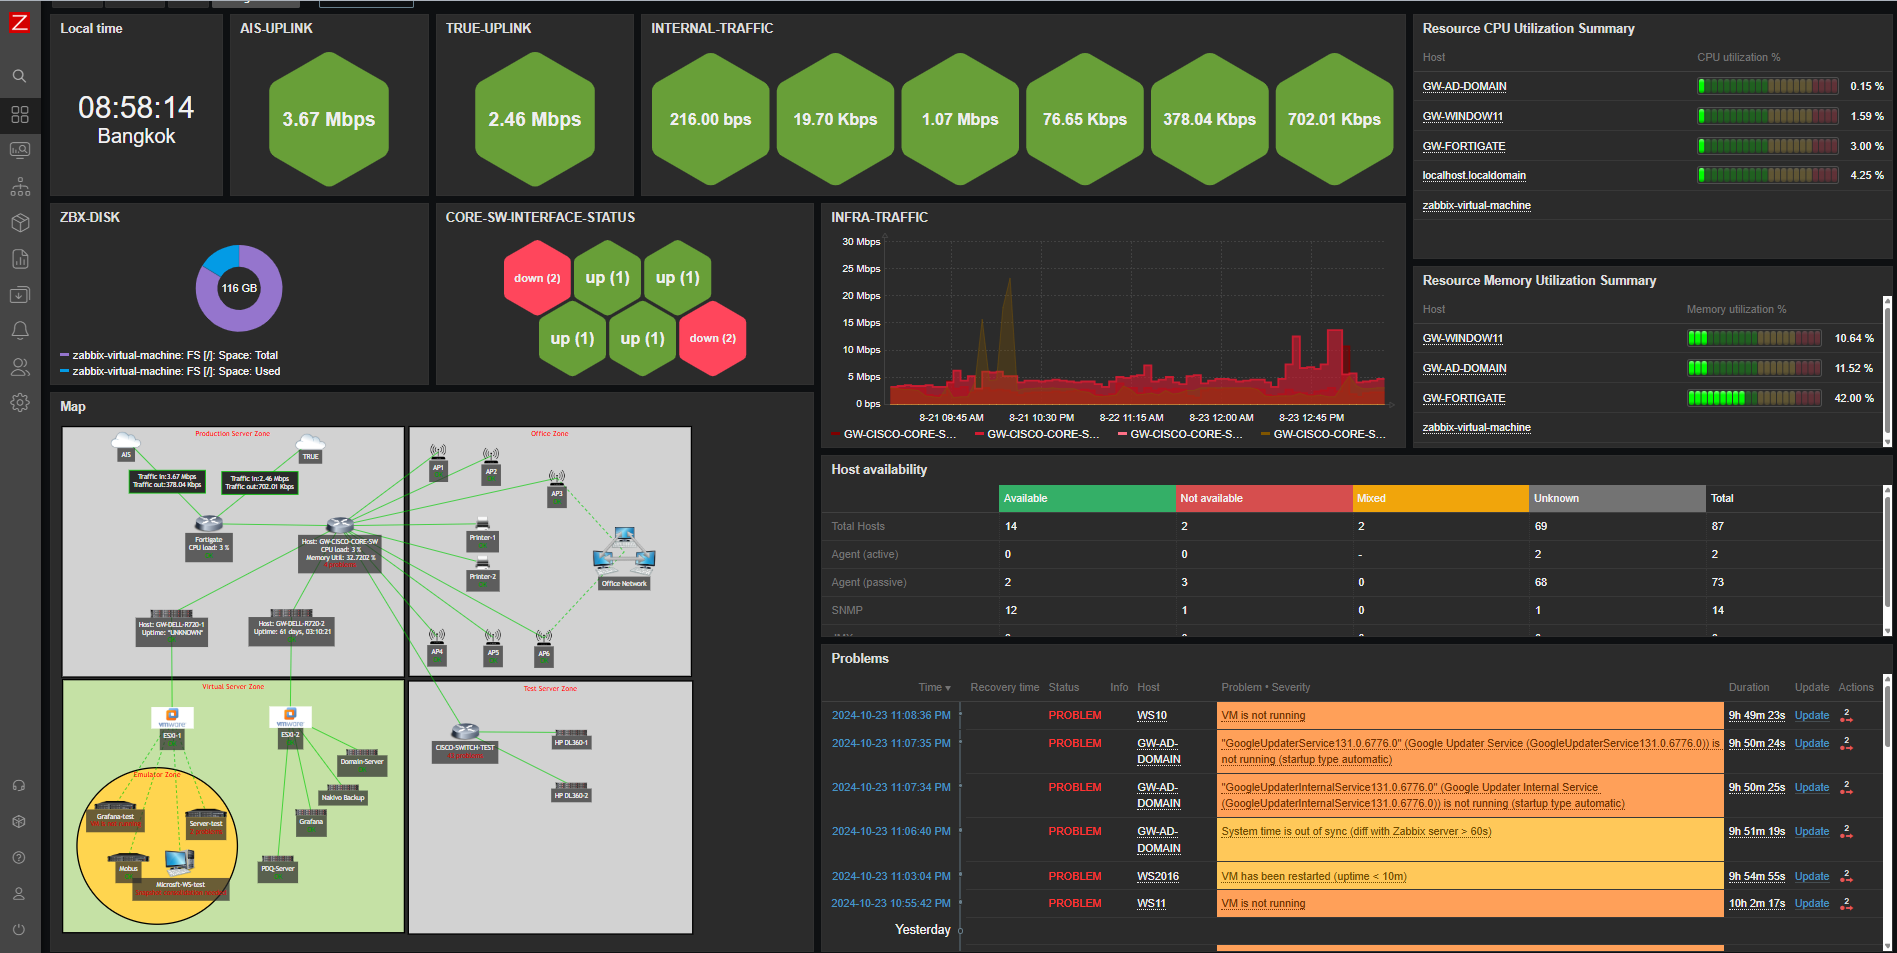
Zabbix is a fully open-source monitoring platform covering networks, servers, cloud services and applications, with no licensing cost at any scale.
source: blog.zabbix.com
What stands out:
- Genuinely free with no device, sensor, or host limits, which makes it the cheapest path to broad coverage.
- Highly customizable templates, triggers and dashboards for teams willing to build.
- A large community and mature commercial support for organizations that need it.
What to consider:
- Engineering time replaces license cost. Initial configuration and ongoing tuning take substantial effort.
- Templates for less common hardware often need to be built, or adapted by hand.
- Security-oriented change auditing isn't its purpose, so pair it accordingly.
Best for: Teams with in-house engineering capacity that would rather spend time than budget.
6. Nagios XI
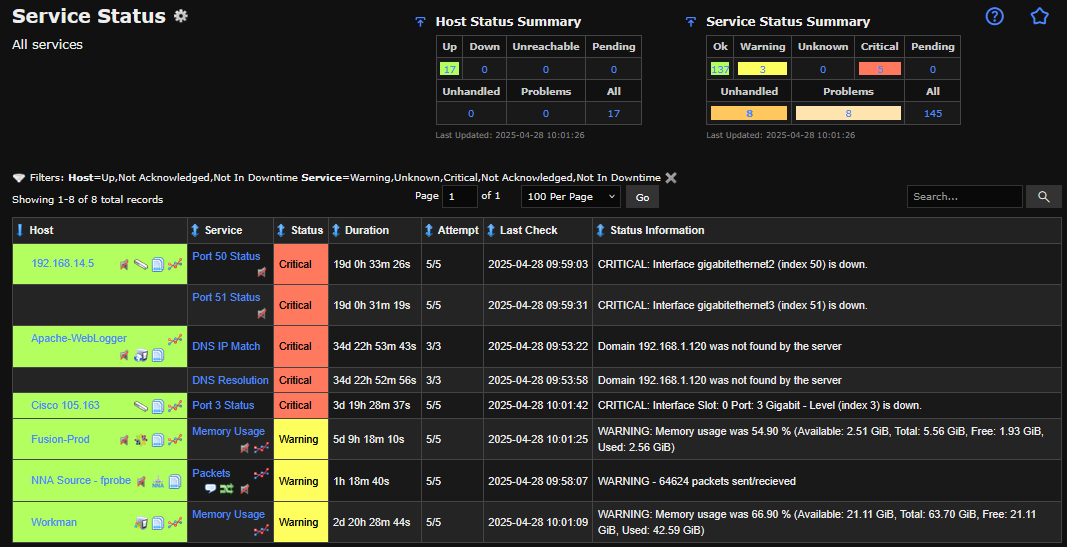
Nagios XI is the commercial edition of the long-running Nagios project, adding a web interface, configuration wizards, reporting and support to the free Nagios Core engine.
source: assets.nagios.com
What stands out:
- An enormous plugin ecosystem built over two decades covers almost any device, or service.
- Nagios Core remains free, which allows a no-cost start and a later upgrade path.
- Configuration wizards and dashboards remove much of the file-editing that Core requires.
What to consider:
- The architecture shows its age next to newer platforms, and the interface reflects that.
- Plugin quality varies, since much of the ecosystem is community-maintained.
- Scaling to large environments requires careful design and often additional components.
Best for: Environments already invested in Nagios Core that want supported tooling around it.
7. Datadog Network Performance Monitoring
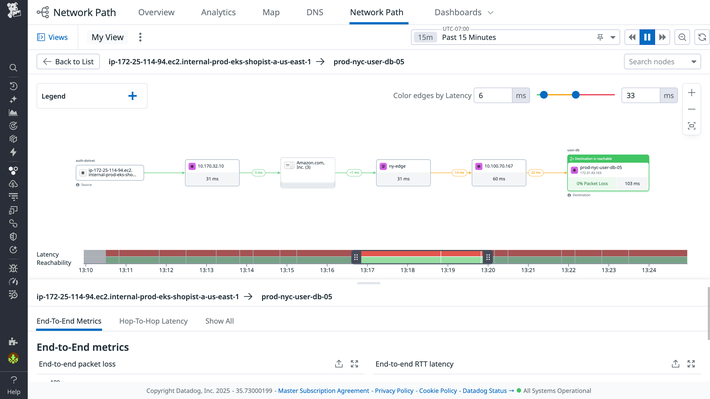
Datadog Network Performance Monitoring analyzes flow between services, containers, availability zones and on-premises hosts, sitting within the wider Datadog observability platform.
What stands out:
- Network telemetry correlates directly with application performance monitoring, logs and infrastructure metrics in one place.
- Strong coverage of cloud-native and containerized environments where traditional SNMP polling doesn't reach.
- Dependency maps between services are generated automatically rather than configured.
What to consider:
- Consumption-based pricing across multiple product lines makes forecasting difficult, and costs can escalate.
- Coverage of traditional network hardware is thinner than dedicated network monitoring tools.
- The agent-based model requires deployment across the estate.
Best for: Cloud-native and hybrid organizations already standardized on Datadog.
8. Auvik Network Management
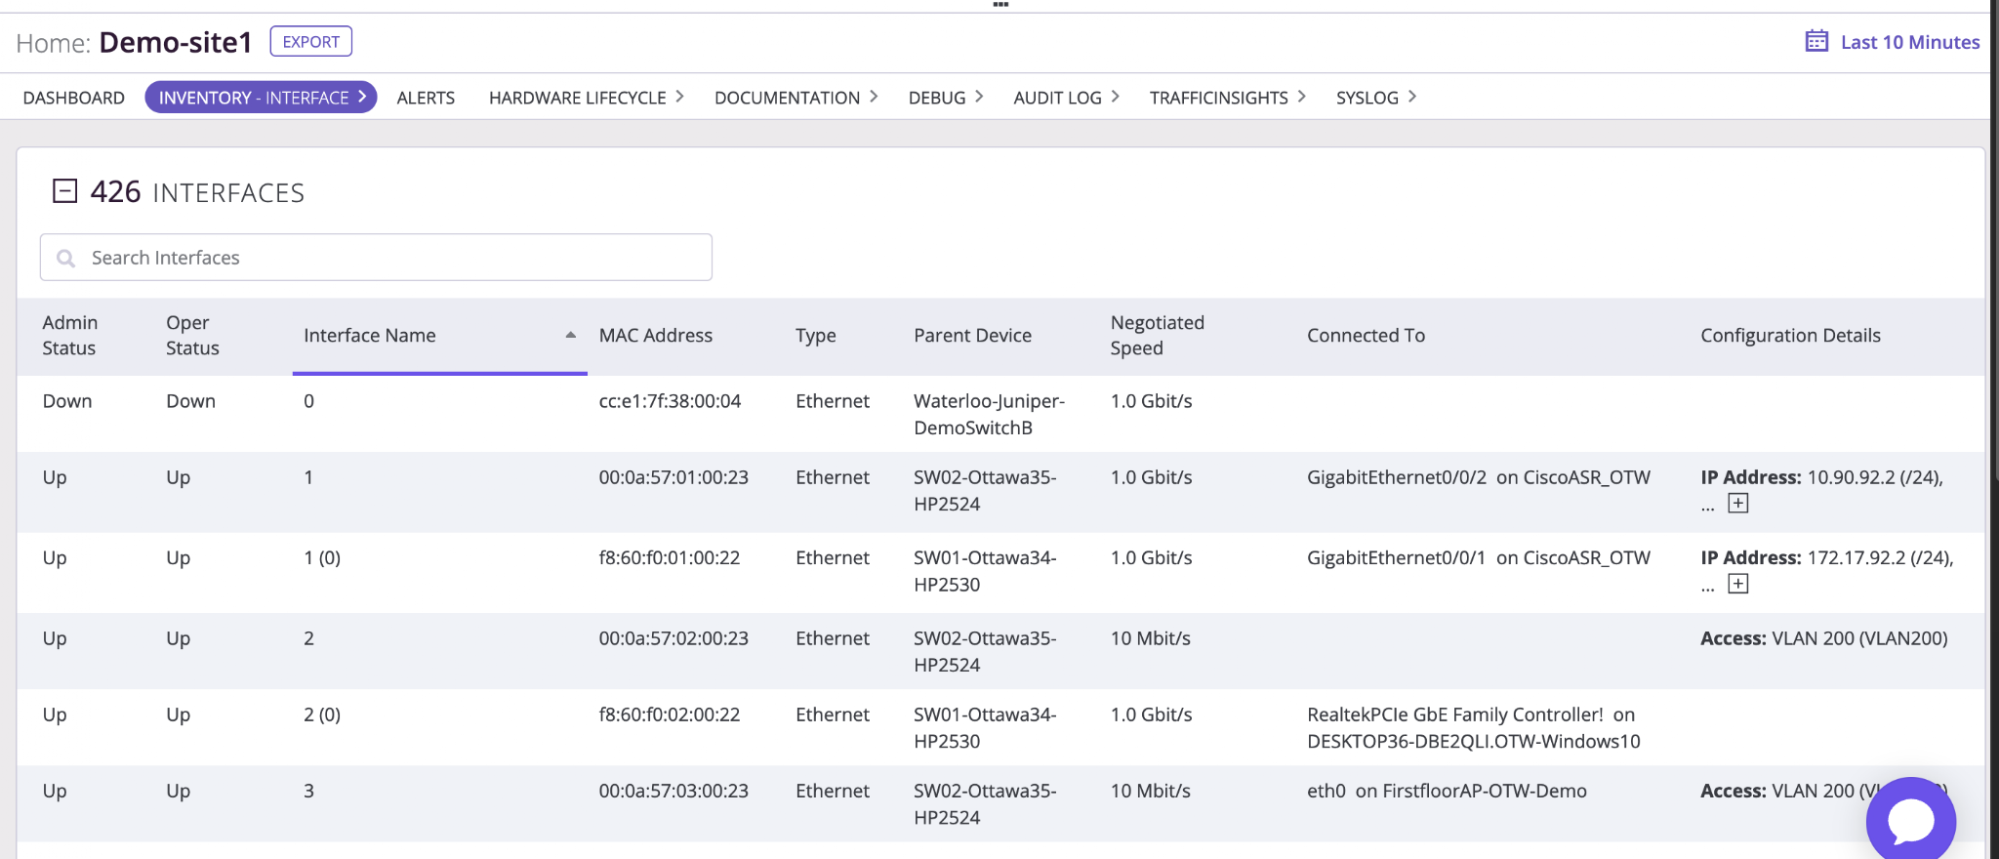
Auvik is a cloud-based network management platform focused on automated topology mapping, configuration backup and remote troubleshooting, built with managed service providers and lean IT teams in mind.
Source: support.auvik.com
What stands out:
- Automated network mapping and inventory stay current without manual maintenance.
- Automatic configuration backup with change detection, including the ability to compare and restore previous versions.
- Multi-site and multi-tenant management suits distributed organizations and service providers.
What to consider:
- Per-device billing applies to network infrastructure devices, so the cost model rewards small device counts.
- Deep performance analysis is lighter than in dedicated on-premises platforms.
- Cloud-only delivery may not satisfy environments with data residency constraints.
Best for: Managed service providers and small teams managing multiple sites.
9. LM Envision by LogicMonitor
LM Envision is a SaaS observability platform monitoring networks, servers, cloud and applications through collectors that gather data agentlessly from monitored systems.

source: logicmonitor.com
What stands out:
- Automated discovery and pre-built monitoring templates significantly shorten time to coverage.
- Agentless collection reduces the deployment burden across large estates.
- Hybrid coverage spans on-premises infrastructure and cloud services in one view.
What to consider:
- Pricing sits at the higher end and scales with the number of monitored resources.
- Deep customization is more constrained than open-source alternatives.
- Change auditing focuses on operational drift rather than security evidence.
Best for: Hybrid environments wanting broad coverage with minimal platform maintenance.
10. Progress WhatsUp Gold
Progress WhatsUp Gold monitors network devices, servers, virtual machines and applications, with a visual mapping interface and a licensing model based on monitored devices.

source: progress.com
What stands out:
- A clear visual topology map makes dependency relationships easy to read during triage.
- Free standalone utilities are available separately for point tasks.
- Device-based licensing is straightforward to model against an inventory.
What to consider:
- Capabilities such as configuration management and flow monitoring are separate add-ons.
- Coverage of non-Windows environments is weaker than Windows-centric monitoring.
- Reporting depth trails the larger enterprise platforms.
Best for: Windows-centric mid-market networks wanting straightforward visual monitoring.
Choose the right network monitoring tools for your environment
Most environments need two things that rarely come in one product. Performance monitoring keeps the network running, and change auditing explains what happened. Teams that buy only the first often discover the gap during an incident or audit, when the question shifts from how the network is performing to who altered it and when.
A practical approach is to pick the performance tool that fits your hardware and licensing model, then confirm separately that device configuration changes and administrative logons are recorded with attribution. Skipping that second step is why monitoring network devices keeps surfacing in post-incident reviews, and why it belongs in any serious list of network security best practices.
Netwrix Auditor covers the change auditing half across network devices and the wider Microsoft estate from one console. Request a demo to see the configuration changes and logons in your own environment.
Frequently asked questions about the best network monitoring tools
Share on
Learn More
About the author

Dirk Schrader
VP of Security Research
Dirk Schrader is a Resident CISO (EMEA) and VP of Security Research at Netwrix. A 25-year veteran in IT security with certifications as CISSP (ISC²) and CISM (ISACA), he works to advance cyber resilience as a modern approach to tackling cyber threats. Dirk has worked on cybersecurity projects around the globe, starting in technical and support roles at the beginning of his career and then moving into sales, marketing and product management positions at both large multinational corporations and small startups. He has published numerous articles about the need to address change and vulnerability management to achieve cyber resilience.
Learn more on this subject
Uncovering indirect attack paths to virtualized domain controllers in Azure
Data classification and DLP: Prevent data loss, prove compliance
CMMC compliance and the critical role of MDM-style USB control in protecting CUI
Data Privacy Laws by State: Different Approaches to Privacy Protection
What Is Electronic Records Management?