
Thousands of risks and no idea where to start: Redesigning Risk Assessment in 1Secure™
Thousands of risks and no idea where to start: Redesigning Risk Assessment in 1Secure™
Nov 5, 2026
It's Monday morning. You open your security dashboard, coffee in hand, and this is what you see: 573 high risks.
Is that bad? Probably. Is it worse than last month? Hard to tell. Which one do you fix first? That's going to take a while to figure out.
This was the starting point of one of the most challenging UX problems I've worked on for 1Secure, Netwrix's SaaS platform for data and identity security. The data was accurate, but a number without meaning is just noise. So we asked ourselves: "How might we turn that noise into something you can act on?"
The 30-second test
Early in the project we set ourselves an uncomfortable goal: a security admin should understand their posture in under 30 seconds. Not "find the information if they dig for it." The should understand it, the moment the page loads with their coffee still in hand.
That constraint ruled out some of the most obvious solutions, like a raw count of risks. Counting isn't understanding, so it fails the test immediately.
So we moved to a risk score with a clear scale, clear zones, and one sentence telling you where you stand.
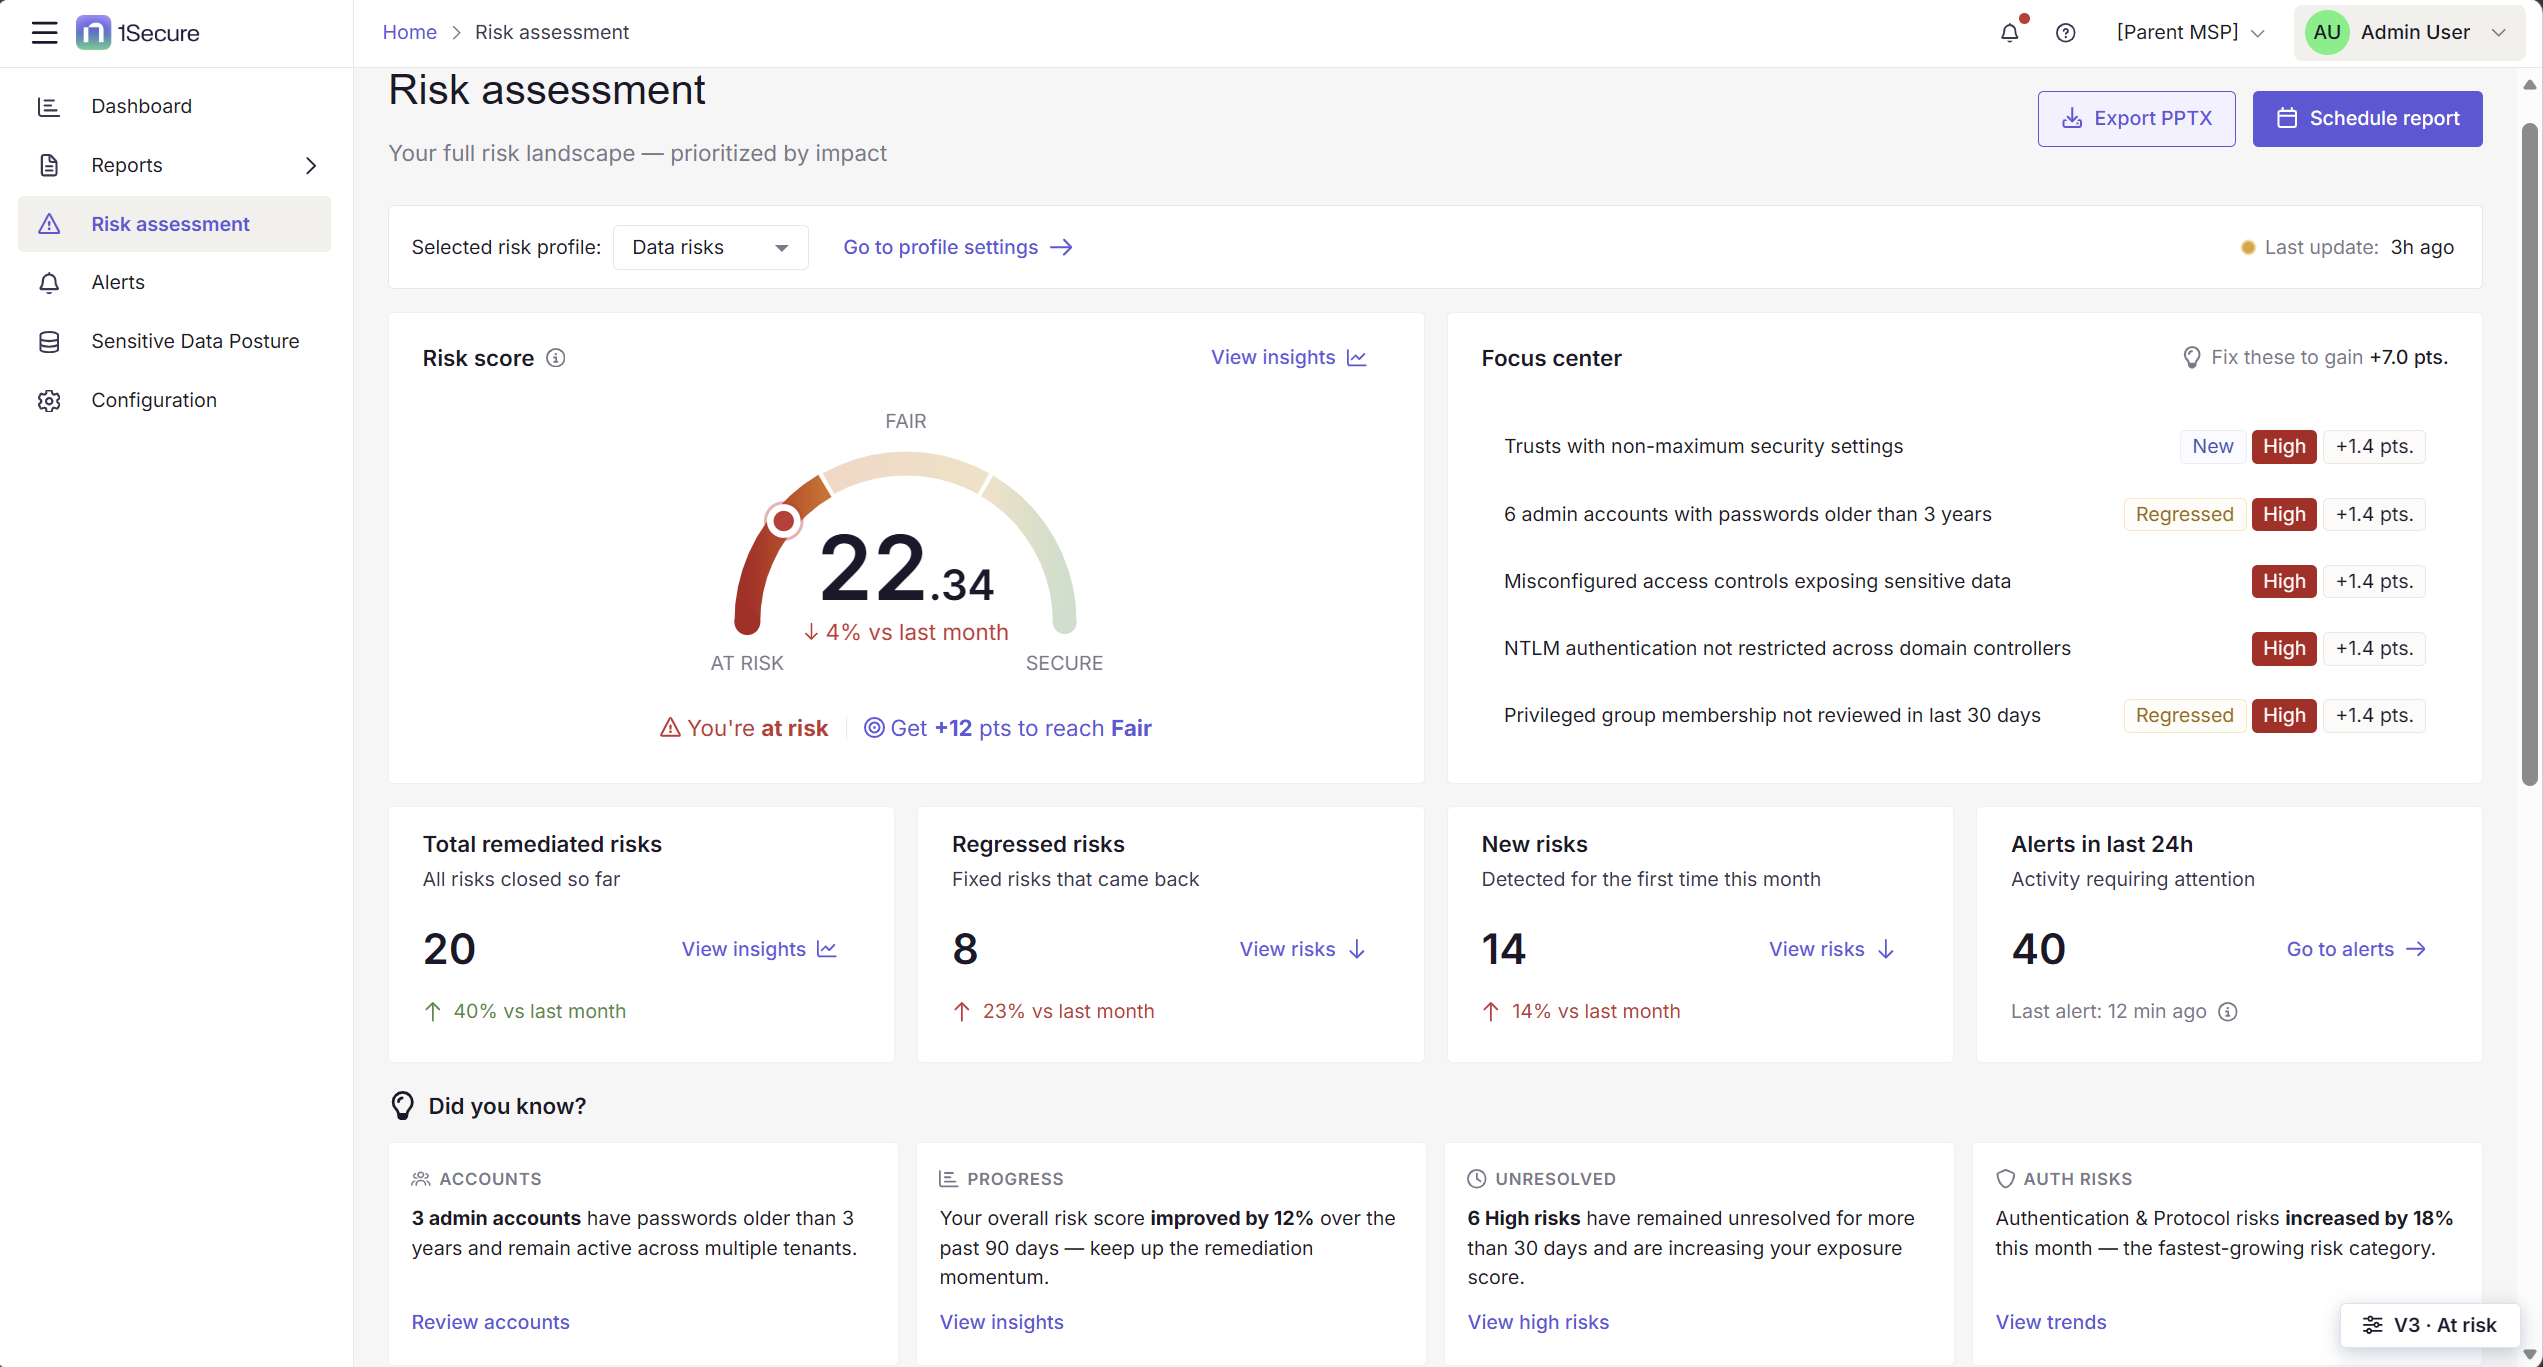
Risk Assessment builds on PingCastle, a tool security teams have trusted for years to tell them where their Active Directory stands. The analysis behind it is solid, so we kept what worked and rebuilt the way it's communicated. The score is weighted, which matters more than it sounds. A high-severity finding affecting 12 admin accounts counts for far more than one stale computer object in a staging OU, so the number reflects impact, not just volume.
And we didn't stop at telling people where they are. We also told them where they're going:
Get +12 pts to reach Fair
We turned a number into a next step. You can see exactly how many points stand between you and the next zone, and which fixes get you there.
Your progress is the whole point
Here's something we heard again and again in our research: security work is relentless and sometimes invisible. You fix 12 things and nobody notices. But a 13th breaks and everyone does.
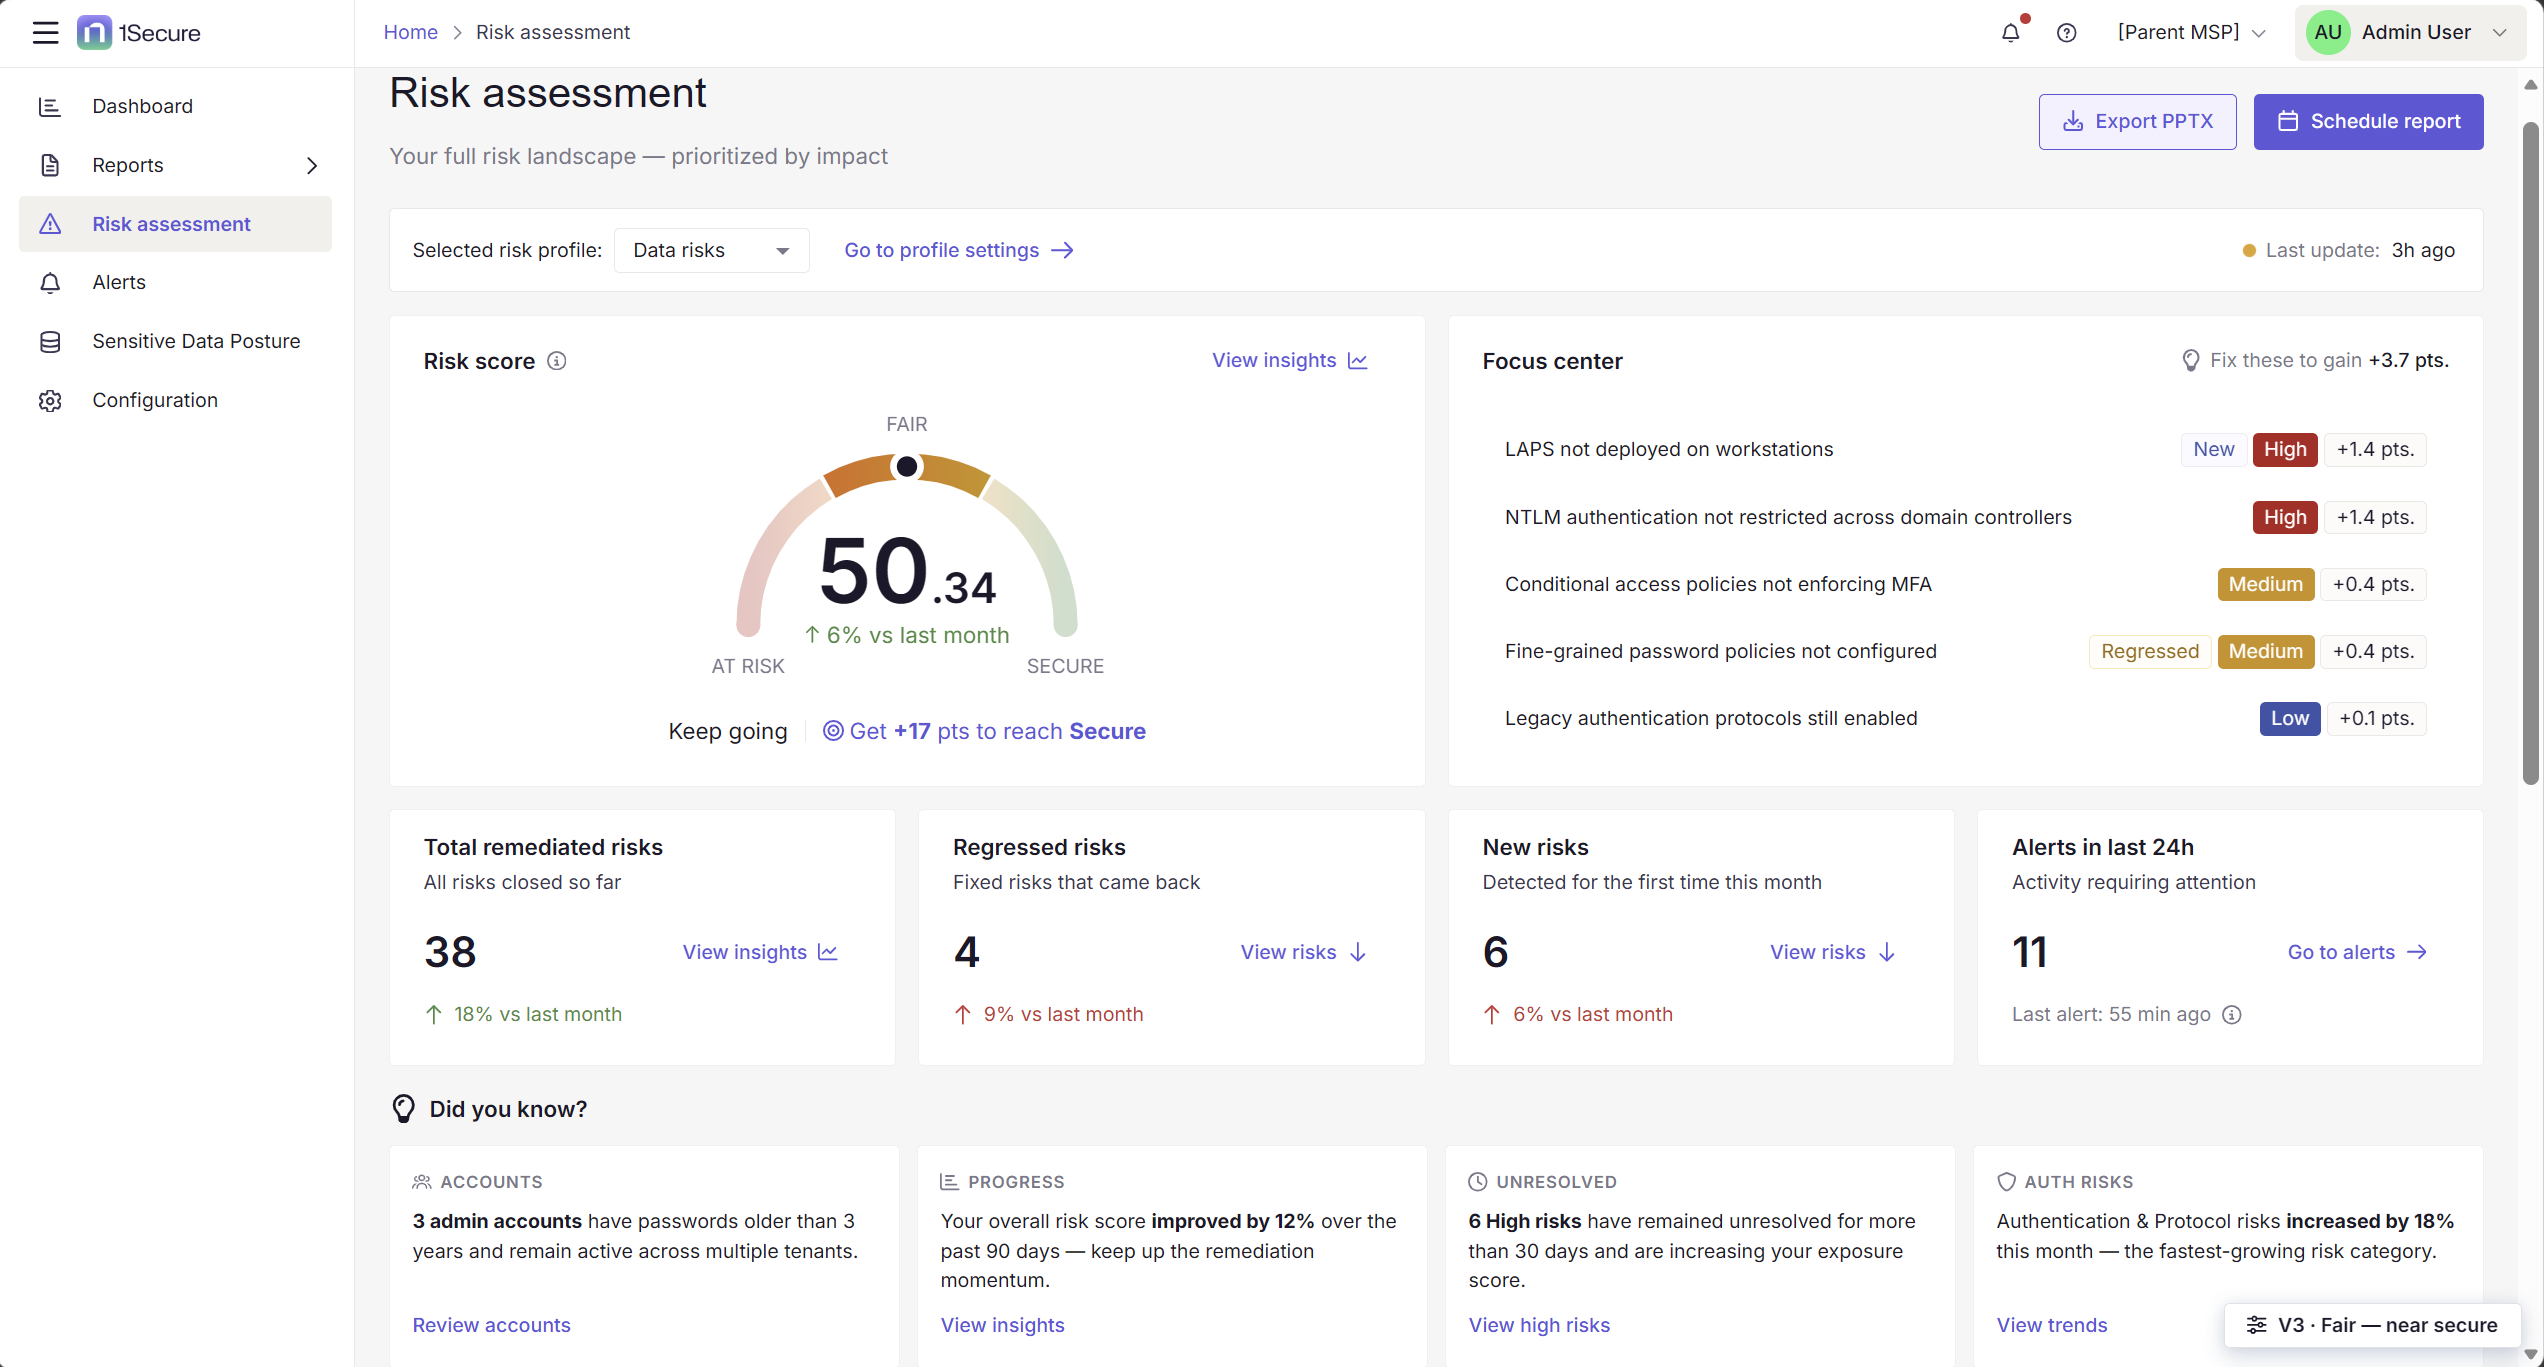
So we made progress impossible to miss. The score moves as you remediate risks, and every fix carries a visible point of value. Trends show whether you're climbing or slipping compared to last month.
Focus center: The feature people fell in love with
If I had to pick the single most validated element of the redesign, it would be this one.
Focus center answers the question every admin opens the page with: "Out of everything that's broken, what do I do right now?" You don’t get a list of 573 things or a severity filter to configure. Instead, it shows the handful of items with the biggest impact on your posture, each with what it'll cost you to ignore it and what you'll gain by fixing it.
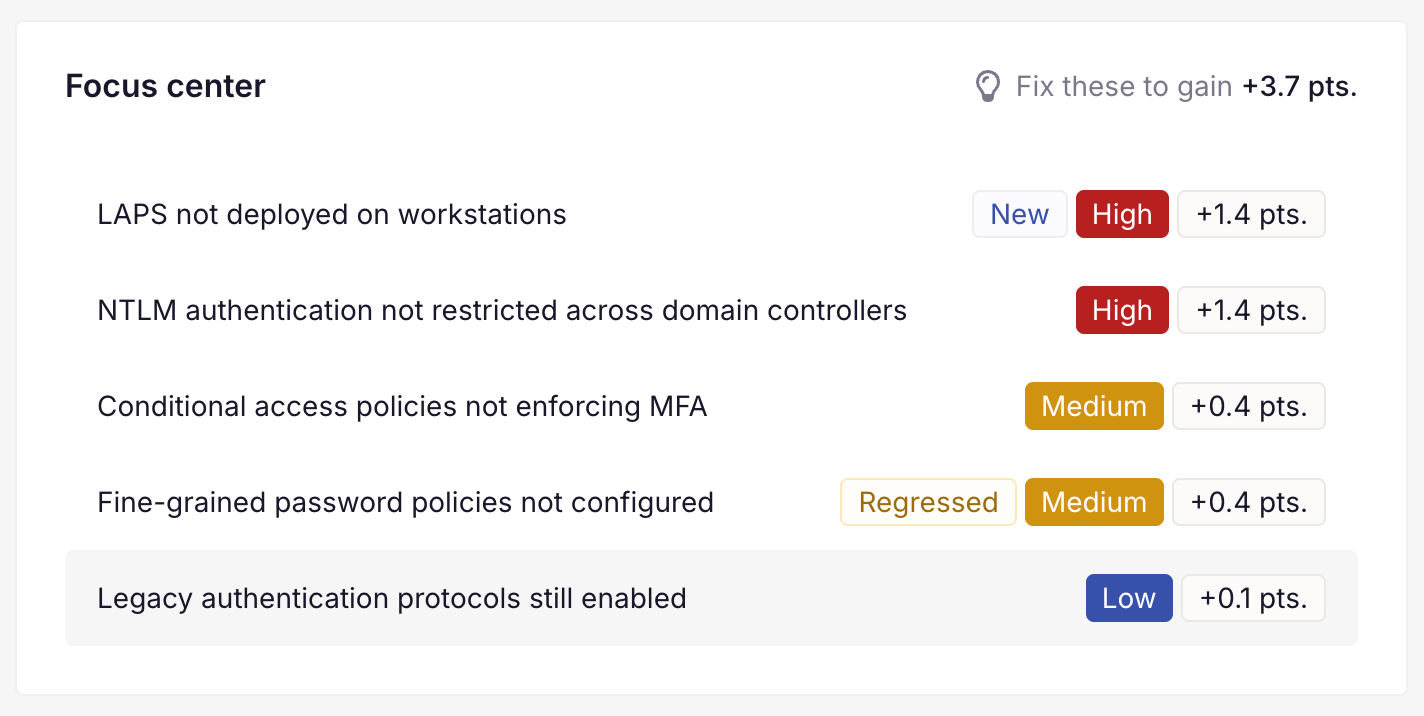
Users loved it because it removed a decision they didn't want to make. Prioritization is exhausting, so we did it for them.
"It [Focus center] helps me a lot. I get a quick understanding of what's going on, what I need to work on, so it definitely helps."
We also added context badges, New and Regressed, because "this just appeared" and "this came back after you already fixed it once" are very different emotional and operational situations, and they deserve different reactions.
Did you know? Turning data into sentences
Numbers tell you what’s happening, but sentences tell you what it means.
- 3 admin accounts have passwords older than 3 years and remain active across multiple tenants.
- Authentication & Protocol risks increased by 18% this month, the fastest-growing risk category.
These are insights you can take straight into a meeting with your CISO without building a single slide. That was a real user need we kept hearing: posture reporting eats hours, and nobody enjoys manually translating dashboards into executive language. This feature is a good reminder that the best ideas show up when design and product tackle a problem together.
Every risk, from whatever angle matters to you
Understanding your posture at a glance is one thing. Working through it is another.
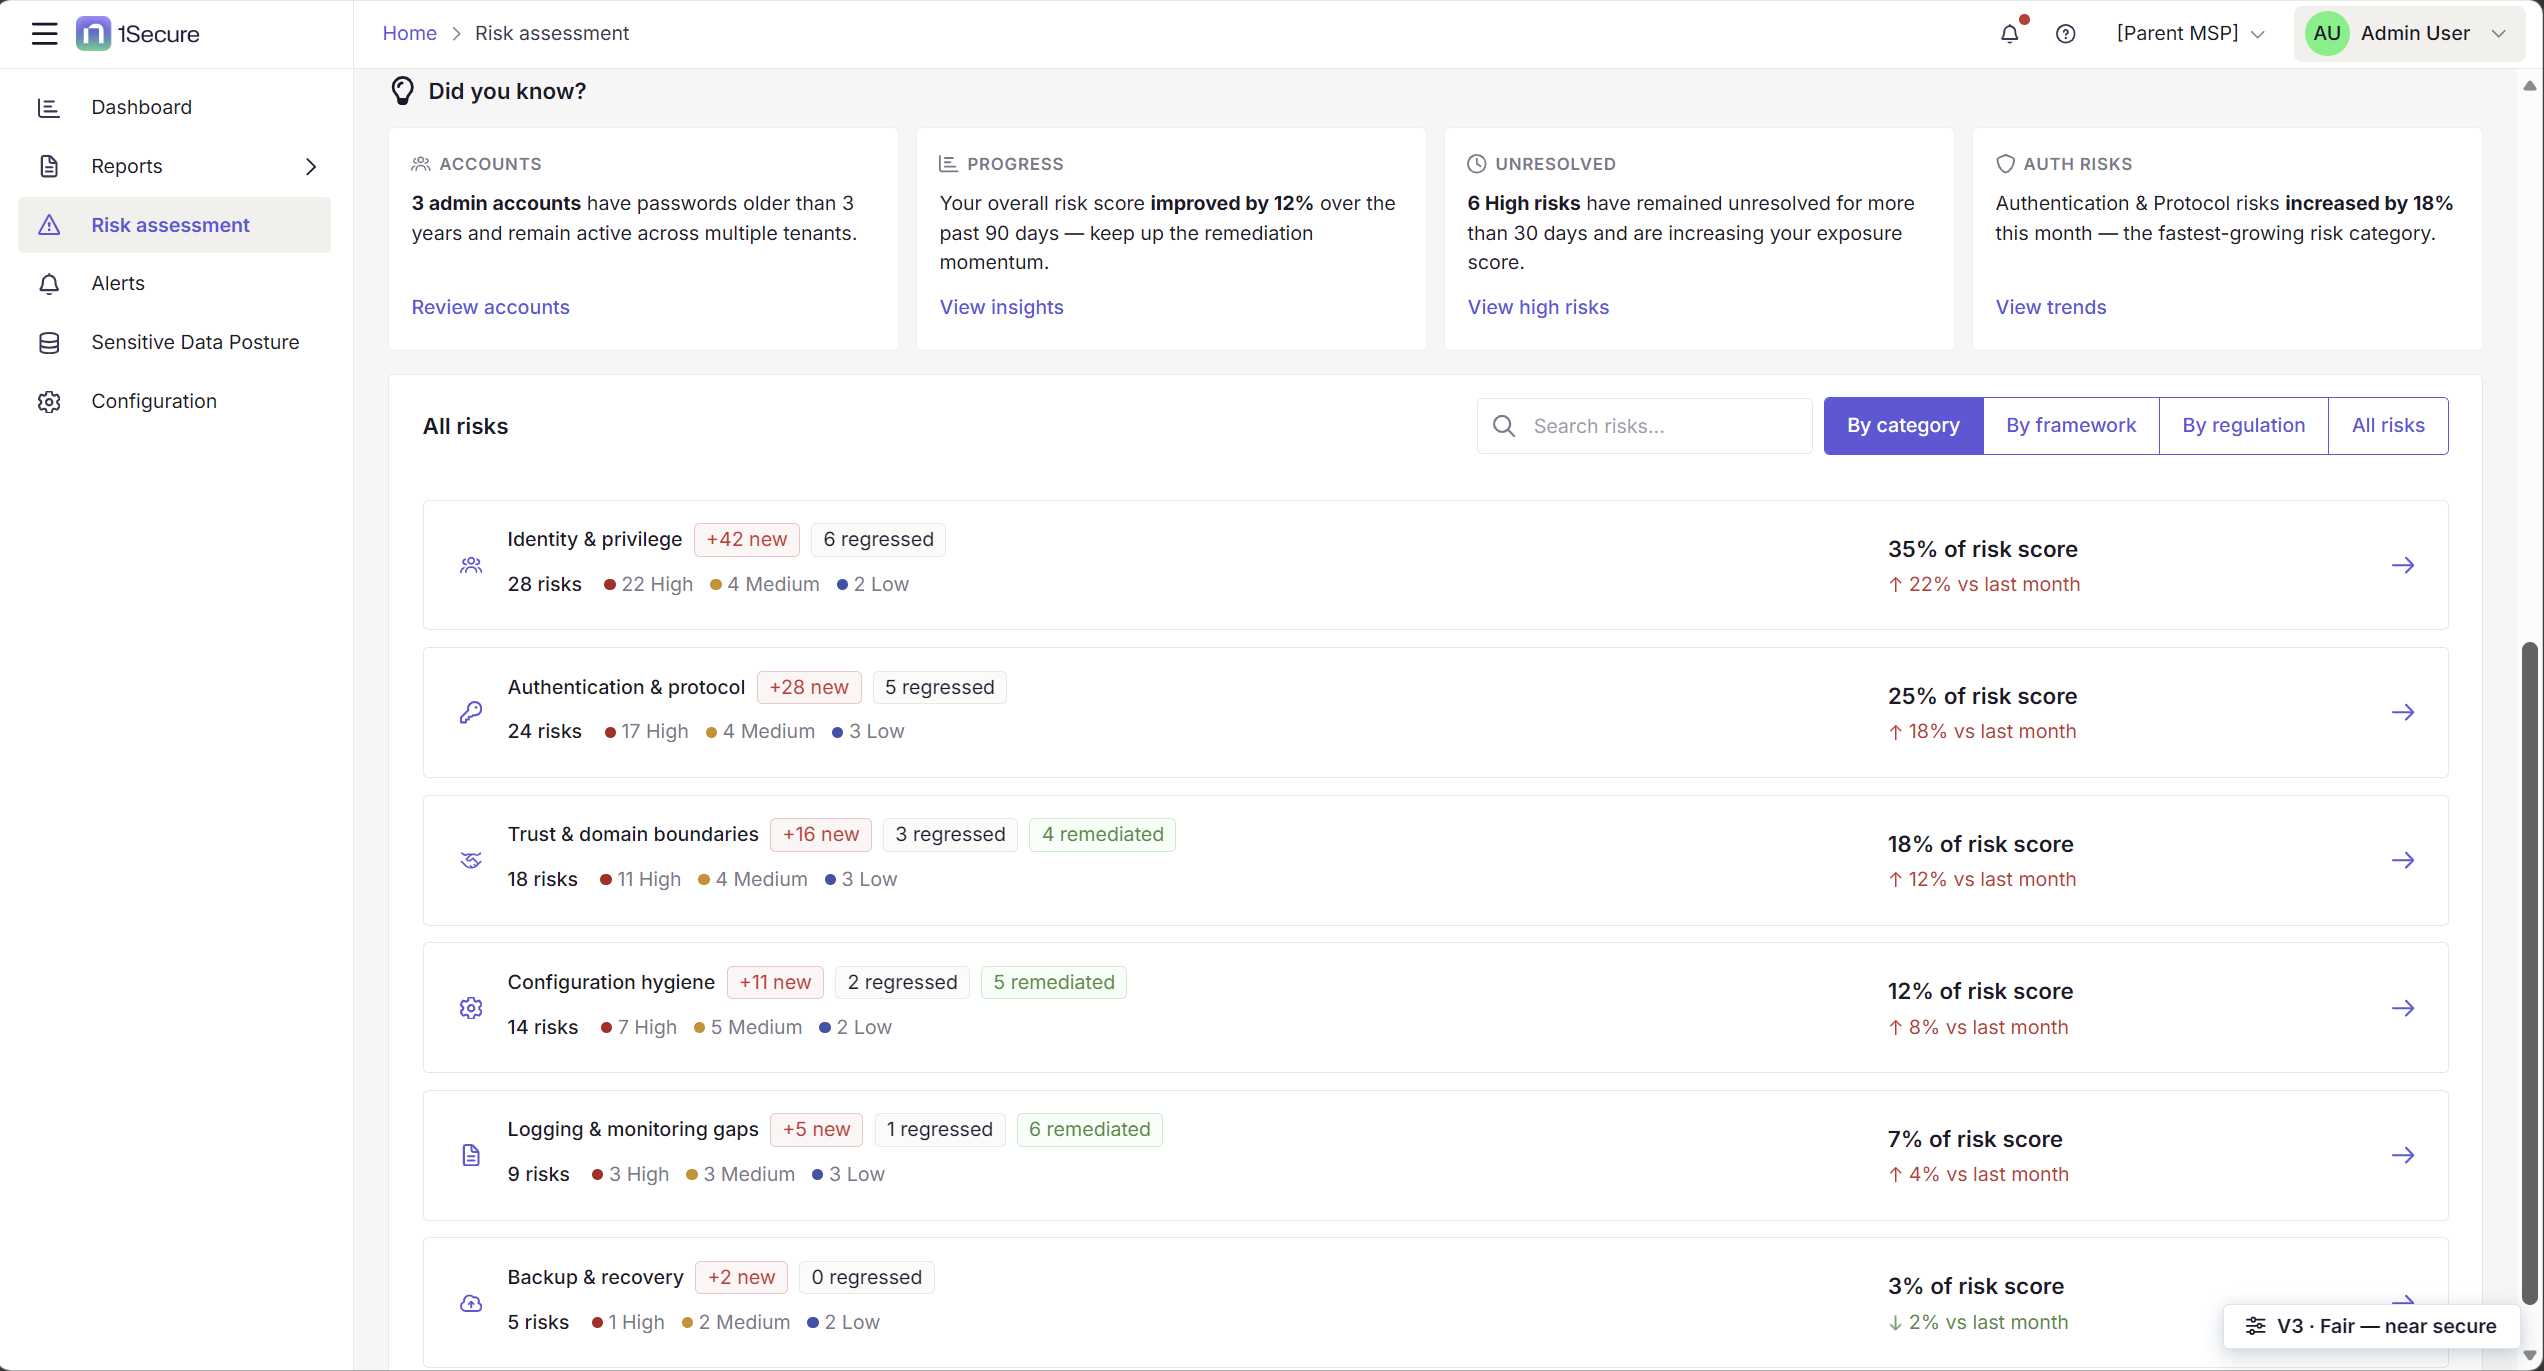
We group All risks by category by default because a flat list of hundreds of findings doesn't tell you where the problem is, but a list of areas does. Identity and privilege carrying 35% of your score is a very different conversation from 7% sitting in logging gaps, and it's often a different team that has to fix each. Every category also shows how it moved since last month, so you see both what's growing and what's big.
Category isn't how everyone thinks, though. A security architect tends to work from a framework, a compliance lead from a regulation. So those are one click away: same risks, different lens. That was our assumption going in, and it's one we want to validate with real usage.
And that's just the surface
Open any individual risk and you get the full story: what the problem is, why it matters, and what it affects. But more importantly, there’s a way out, whether that’s a ready-made remediation you can apply directly or a conversation with AI to explore alternative approaches when the standard fix doesn't suit your environment.
Identifying a risk is the easy half; closing it is where the work lives.
What I took away from this
The hardest part of this project was resisting the urge to show everything.
Every stakeholder had a chart they loved. Every dataset had a story it wanted to tell. But every single element we considered adding had to survive the same question: “Does this help someone understand their posture faster?”
A surprising amount of good design is subtraction.
We shipped a dashboard that tells you where you stand, where you're going, what to fix first, and how far you've come, all in under 30 seconds.
Which is, I think, the least a security team deserves on a Monday morning.
Start your journey with 1Secure Risk Assessment
See 1Secure Risk Assessment in action. Explore the experience with sandbox data or connect your own environment through our simple, guided trial.
Share on
Learn More
About the author

Aleksandra Sroka-Knapik
Senior Product Designer
Aleksandra Sroka-Knapik is a Senior Product Designer at Netwrix, where she shapes product design and design engineering across the company's identity threat detection and response (ITDR) portfolio. She brings UX best practices to complex, enterprise-grade security products, balancing user needs, business goals, and technical constraints. She drives design end-to-end, from user research, workshops, and customer feedback sessions through to delivery. She is also defining the new unified UI for the 1Secure SaaS ecosystem and evolving the Netwrix Design System, while using AI to accelerate design workflows and product development. Before Netwrix, she led design projects across SaaS, web, and mobile products in a wide range of industries, from fintech and education to automotive, e-commerce, and health.
Learn more on this subject
Netwrix Innovation Week: 1Secure™ with Agentic AI security
Bring Your Own Vault: Why "rip and replace" isn't the only option
Beyond the vault: Zero standing privilege defeats more than password attacks
The password was never the only problem: Legacy PAM vs. modern PAM
Netwrix Innovation Week: Why agentic AI security matters